Probabilistic forecasting by Agile teams is increasingly becoming a more common practice in the industry, particularly due to the great work of people such as Larry Macherrone, Troy Magennis, Julia Wester, Dan Vacanti and Prateek Singh. One question that isn’t particularly well documented is how accurate is it? Here we look at 25 ASOS teams’ data to find out just how right (or wrong!) it really is…

Whatever your views on the relevance in 2023 of the Agile Manifesto, no practitioner should ignore the very first line of “uncovering better ways”. I’ve always tried to hold myself and peers I work with true to that statement, with one of my biggest learning/unlearning moments being around velocity and story points. Instead of these approaches, moving towards techniques such as probabilistic forecasting and Monte Carlo simulation (I have Bazil Arden to thank for introducing me to it many years ago) is more aligned to modern, more complex environments. I don’t intend to cover the many pitfalls of story points and/or velocity, mainly because I (and many others) have covered this in great detail previously.
The challenge we face with getting people to adopt approaches such as probabilistic forecasting is that those sceptical will often default to asking, “well how accurate is it?” which can often lead to many people being confused. “Erm…not sure” or “well it’s better than what you do currently” are often answers that unfortunately don’t quite cut it for those wanting to learn about it and potentially adopt it.
Whilst those familiar with these techniques will be aware that all models are wrong, we can’t begrudge those who are motivated by seeing evidence in order to convince them to adopt a new way of working. After all, this is how the diffusion of innovations works, with those in the early majority and late majority motivated by seeing social proof, aka seeing it working (ideally in their context):

Source:
Yet social proof in the context of probabilistic forecasting is hard to come by. Many champion it as an approach, but very few share just how successful these forecasts are, making it very difficult for this idea to “cross the chasm”.
Why validating forecasts is important
The accuracy of forecasts is not only important for those wanting to see social proof of them working, but this should in fact matter for anyone practicing forecasting. As Nate Silver says in the Signal and the Noise:
One of the most important tests of a forecast — I would argue that it is the single most important one — is called calibration. Out of all the times you said there was a 40 percent chance of rain, how often did rain actually occur? If, over the long run, it really did rain about 40 percent of the time, that means your forecasts were well calibrated. If it wound up raining just 20 percent of the time instead, or 60 percent of the time, they weren’t.
A quick sense check for anyone using these approaches should be about just how frequently they validate what was forecast against the actual outcome. In the same way when it’s forecast to be sunny and a rain shower occurs, people don’t forget significantly wrong forecasts — just ask Michael Fish!
[embed]https://www.youtube.com/watch?v=NnxjZ-aFkjs[/embed]
Therefore, it’s essential when using these probabilistic approaches that we regularly validate the difference in what we forecast vs. what occurred, using that as learning to tweak our forecasting model.
How we forecast
Coming back to the matter at hand, it’s worth noting that there is no single approach to Monte Carlo simulation. The simplest (and the one we coach our teams to use) is to use random sampling — taking a random number from a random distribution. You can however have other approaches (for example Markov Chain), but it is not intended for the scope of this blog to compare these. If you would like to know more, I’d highly recommend Prateek Singh’s blog comparing the effectiveness of each approach.
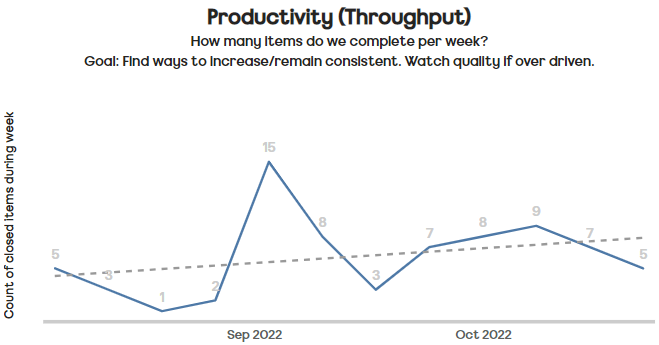
For our teams here at ASOS, we use random sampling of historical weekly throughput:
This then feeds into our forecasts on “when will it be done?” or “what will we get?” — the two questions most commonly asked of our teams.
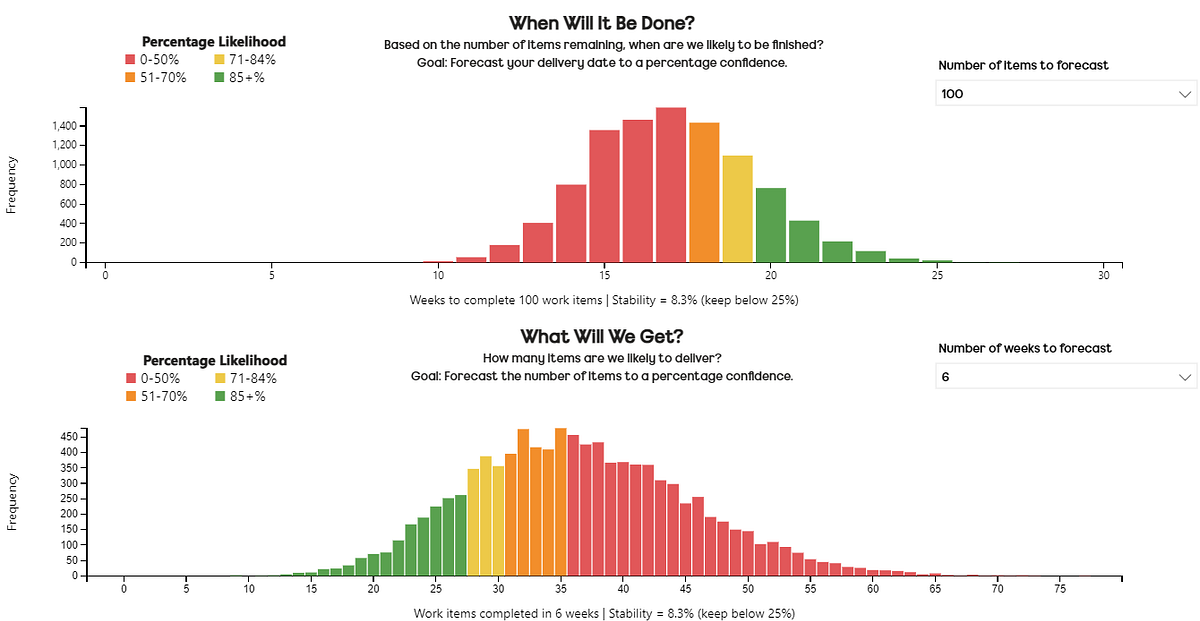
Each forecast contains 10,000 simulations, with the outcome distribution viewed as a histogram. Colour coding shows a percentile likelihood for an outcome — for example, in the image shown we can see that for When Will It Be Done we are 85% likely (furthest left ‘green bar’) to take 20 weeks or less to complete 100 items. For What Will We Get we are 85% likely (furthest right ‘green bar’) to complete 27 items or more in the next six weeks.
There is also a note on the x-axis of the stability of the input data.
This shows the stability between two random groups of the samples we are using.
Forecast factors
In terms of what I set out to achieve with this, there were four main things I wanted to be more informed about:
Just how wrong are the forecasts?
What percentile (50th / 70th / 85th) is ‘best’ to use?
How big a factor is the amount of historical data that you use?
How different are the results in short term (2–4 weeks) and long term (12–16 weeks) forecasts?
In terms of the forecasting approach, the focus was on the ‘what will we get?’ forecast, mainly due to this being easier to do at scale and that very few of our teams have strict, imposed delivery date deadlines. Historical data of 6, 8, 10 and 12 weeks was used to forecast for a given period (in this example, the next 2 weeks) the number of items a team would complete.

This would then be captured for each team, with forecasts for 2, 4, 8 and 12 weeks using 6–12 weeks’ historical data. The forecasts to be used to compare would be the 50th, 70th and 85th percentiles.
A snapshot of the forecast table looking like so:

In total I used 25 teams, with 48 forecasts per team, meaning there were 1200 forecasts to compare.
Anyone who has used these approaches in the past will know how important a factor having historical data that is a fair reflection of the same work you will be doing in the future. Across 25 teams this is somewhat hard to do, so I settled with choosing a time of year for historical data that could (at best) reflect the forecast period for bank holidays in the UK. With the forecast being done on 25th April 2022 it incorporated two previous bank holidays (15th and 18th April 2022 respectively). The next 2–4 weeks from the forecast date having one bank holiday (2nd May 2022), the 8–12 weeks having three (2nd May, 2nd June and 3rd June 2022) bank holidays.
Validating forecast accuracy
After a brief DM exchange with Prateek, he informed me of an approach he had taken in the past where he had used brier score. This is a way to verify the accuracy of a probability forecast.
Whilst this is completely valid as an approach, for an audience that can take a while to grasp the concept of Monte Carlo simulation, I decided best to not add another data science element! Similarly, people are more interested in if, say you forecast 40 items, how far above/below that were the team. Therefore, a better answer really is to know how wrong we were. Due to this I chose to go with something far simpler, with two visualizations showing:
How often forecasts were right/wrong
How far out (in terms of % error) each forecast was
The results
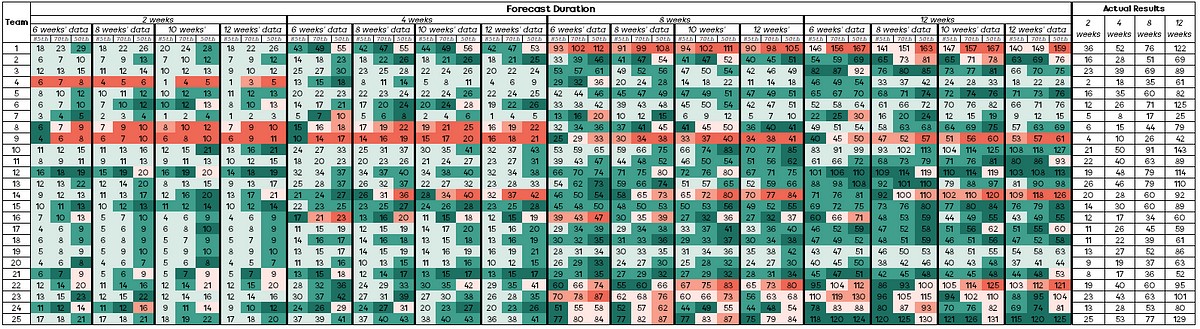
As it’s a lot of data for someone to quickly view and understand the outcomes, my initial results were simply visualised in a table like so:
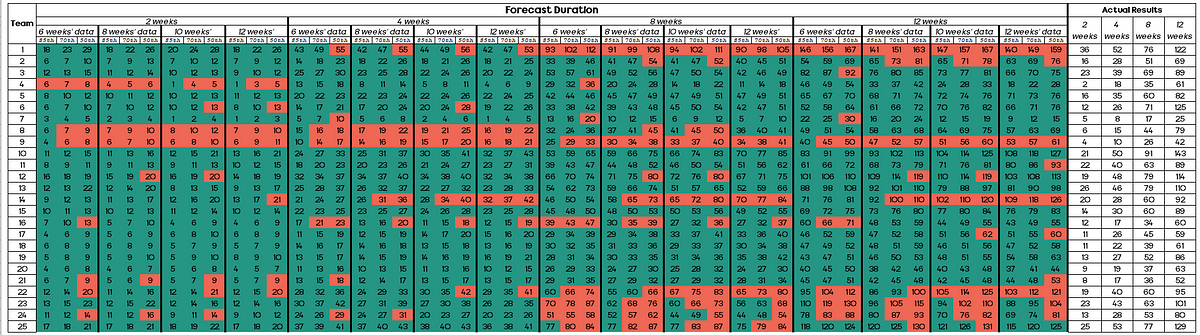
Any time a cell is green this means that the forecast was correct (i.e. the team completed the exact OR more than number of items).
Any time the cell is red this means that the forecast was incorrect (i.e. the team completed less than the number of items forecast).
Some observations with this were:
Using the 85th percentile, this was ‘correct’ in 361 out of 400 (90%) of forecasts. This compares with 336 out of 400 (84%) for the 70th percentile and 270 out of 400 (68%) for the 50th percentile
Forecasts that were longer term (8 or 12 weeks) were ‘incorrect’ 25% (150 out of 600) of the time compared to 16% (93 out of 600) of the time for short term (2 or 4 weeks) forecasts
The difference in terms of how much historical data to use and the forecast outcome was minimal. 6 weeks’ historical data was ‘incorrect’ 19% (56 out of 300) of the time, 8 weeks’ was 20% (60 out of 300), 10 weeks’ was by 23% (68 out of 300) and 12 weeks’ was 19% (59 out of 300)
Teams 8 and 9 are standouts with just how many forecasts were incorrect (red boxes). Whilst it’s not in scope to provide an ‘answer’ to this — it would be worth investigating as to why this may have happened (e.g. significant change to team size, change in tech, new domain focus, etc.)
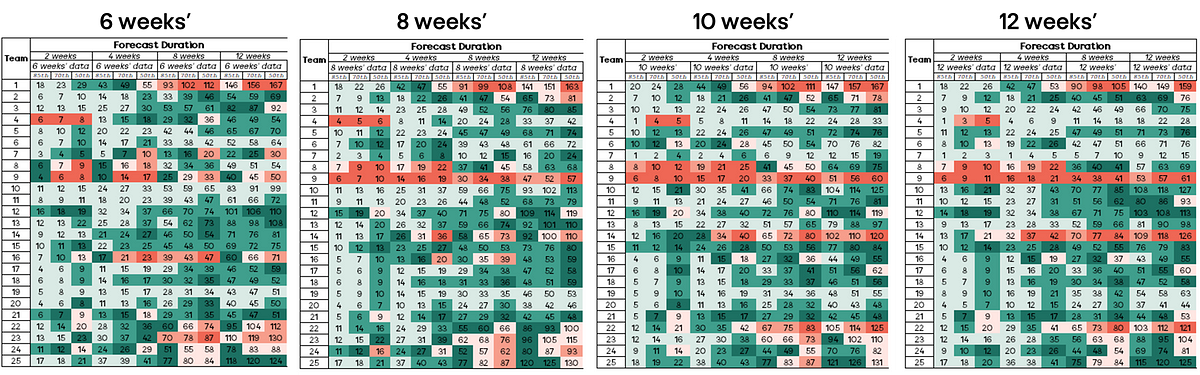
If you have that age old mantra of “under promise, over deliver”, then completing more items than forecasted is great. However, if you forecast 10 items and you completed 30 items then chances are that’s also not particularly helpful for your stakeholders from a planning perspective! Therefore, the other way we need to look at the results is in terms of margin of error. This is where the notion of ‘how wrong’ we were comes into play. For example, if we forecasted 18 items or more (85th percentile) and 29 items or more (50th percentile) and we completed 36 items, then the 50th percentile forecast was close to what actually occurred. Using the previous language around ‘correct’ or ‘incorrect’, we can use a scale of:

The results look like so:
Again, some interesting findings being:
281 of the 1200 forecasts (23%) were within +/- 10% (dark green or pink shade) of the actual result
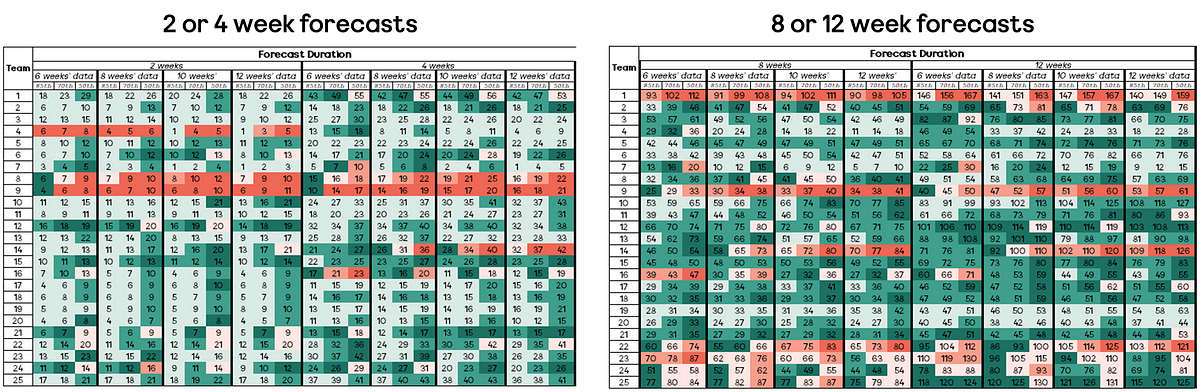
Short term forecasts (2 or 4 weeks) tend to ‘play it safe’ with 297/700 (42%) being ‘correct’ but more than 25% from the actual outcome (light green shade)
Whilst forecasts that were long term (8 or 12 weeks) were ‘incorrect’ more often than short term (2 or 4 weeks) forecasts, those short-term forecasts were significantly more incorrect than the long-term ones (shown by darker red boxes to the left of the visual)
85th percentile forecasts were rarely significantly incorrect, in fact just 9 of 400 (0.5%) of these were more than 25% from the actual outcome
Coming back to the initial questions
In terms of what I set out to achieve with this, there were four main things I wanted to be more informed about:
Just how wrong are the forecasts?
In order to answer this, you need to define ‘wrong’. To keep this simple I went with wrong = incorrect = forecasting more than what the team actually did. Using this definition and looking at our first visual we can see that forecasts are wrong 20% of the time, based on the forecasts made (243 out 1200 forecasts).
What percentile (50th / 70th / 85th) is ‘best’ to use?
This really is all about how far out you’d like to forecast.
For short term (2–4 weeks) forecasts, you’re more likely to get closer ‘accuracy’ with the 50th percentile, however this does also mean more risk as this had a higher frequency of over forecasting.
The 85th percentile, whilst often correct, was still some way off the actual outcome. Therefore, for short term forecasts, the 70th percentile is your best bet for the best balance of accuracy vs risk of being wrong.

For long term forecasts, the 85th percentile is definitely the way to go — with very few significantly incorrect forecasts.
How big a factor is the amount of historical data that you use?
It isn’t immediately obvious when we compare the visuals what the answer to this is.
When looking at how often they were incorrect, this ranged from 19–23% of the time. Similar applies when looking at accuracy (3% variance) within 10% of the actual number of items. Therefore, based on this data we can say that the amount of historical data (when choosing between 6–12 weeks) does not play a significant factor in the outcomes of forecast accuracy.
How different are the results in short term (2–4 weeks) and long term (12–16 weeks) forecasts?
This one was the most surprising finding — generally it’s an accepted principle that the longer out your forecast is, the more uncertain it is likely to be. This is because there is so much uncertainty of what the future holds, both with what it is the team may be working on but also things such as the size of the team, things that may go wrong in production etc.
When looking at the short term vs long term forecasts, we see a much higher degree of accuracy (darker green boxes) for the longer term forecasts, rather than those that are short term.
Conclusion
The main reason for this study was to start to get some better information out there around Monte Carlo simulation in software development and the “accuracy” of these approaches. Hopefully the above provides some better insight if you’re new to or experienced in using these approaches. Please remember, this study is based on the tools we use at ASOS — it may well be other tools out there that use different approaches (for example Actionable Agile uses daily throughput samples rather than weekly and I’d love to see a comparison). It is not the intent of this article to compare which tool is better!
As stated at the beginning, “all models are wrong” — the hope is these findings give some insight into just how wrong they are and, if you’re considering these approaches but need to see proof, here is some evidence to inform your decision.
One final point to close, never forget:
It is forecasting’s original sin to put politics, personal glory, or economic benefit before the truth of the forecast. Sometimes it is done with good intentions, but it always makes the forecast worse
(Nate Silver — The Signal & The Noise)