
The final of this three-part series on moving away from Story Points and how to introduce empirical methods within your team(s).
Part one refamiliarised ourselves with what story points are, a brief history lesson and facts about them, the pitfalls of using them and how we can use alternative methods for single item estimation.
Part two looked at probabilistic vs. deterministic thinking, the use of burndown/burnups, the flaw of averages and monte carlo simulation for multiple item estimation.
Part three focuses on some common questions and challenges posed with these new methods, allowing you to handle those questions you may get asked when wanting to introduce a new approach in your teams/organisation.
The one question I get asked the most
Would you say story points have no place in Agile?
My personal preference is that just like Agile has evolved to be a ‘better way’ (in most contexts) than Waterfall, the methods described in this series are a ‘better way’ than using Story Points. Story Points make sense to be used in contexts where you have little or no dependencies and spend more time ‘doing’ than ‘waiting’.
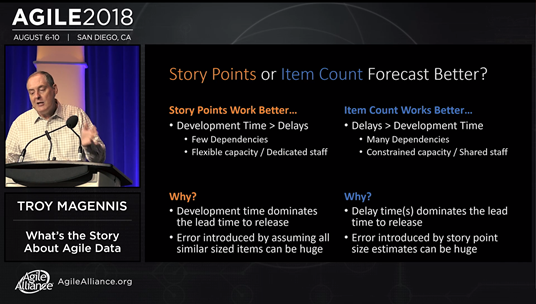
Troy Magennis — What’s the Story About Agile Data
The problem is that so few teams in a large organisation like ours have this context yet have been made to “believe” story points are the right thing to do. For contexts like this, teams are much better off estimating the time they will spend ‘blocked’ or ‘waiting’, rather than the active time ‘doing’.
Common questions posed for single item estimation
But the value is in the conversation, isn’t that what story points are about?
Gaining a shared understanding of the work is most definitely important! The problem is that there are much better ways of understanding the problem you’re trying to solve than giving something a Fibonacci number and debating if something is a ‘2’ or a ‘3’ or why someone feels that way about a number. You don’t need a ‘number’ to have a conversation — don’t confuse estimation with analysis! The most effective way to learn and understand the problem is by doing the work itself. This method provides a much more effective approach in getting to that sooner than story points do.
Does this mean all stories are the same size?
No! This is a common misconception you may hear. What we care about is “right sizing” our items, meaning they are no larger than an agreed size.
This is derived by using the 85th (or the number of your choice!) percentile, as mentioned in part one.
What about task estimation?
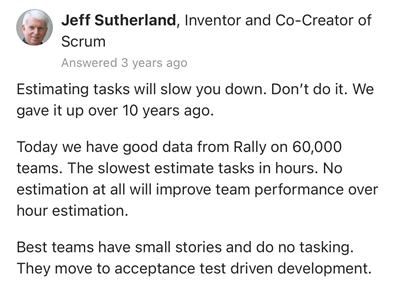
Not using tasks encourages collaboration, swarming and getting stories (rather than tasks) finished. It’s quite ironic that proponents of Scrum encourage sub tasks, yet one of the creators of Scrum (Jeff Sutherland) holds a different view, supported by data. In addition to this, Microsoft found that using estimates in hours had errors as large as ±400% of the estimate.
Should we not use working days and exclude weekends?
Whilst there is nothing to say excluding weekends is ‘bad’ — it again comes back to the principle of talking in the language of our customer. If we have a story that we say on 30th April 2021 has a 14-day cycle time at 85% likelihood — when is reasonable to expect it? It would be fair to say this is on or around 14th May.
Yet if we meant 14 working days this would be 21st May (due to the bank holiday) — which is a whole week extra! Actual days again makes it easier for our customers/stakeholders to understand as we’re talking in their language.
Do you find stakeholders accepting this? What options do you have when they don’t?
Stakeholders should (IMO) never *tell* a team how to estimate, as that is owned by the team. What I do communicate is the options they have on the likelihood. I would let them know 85% still has risk and if they want less risk (i.e., 90th/95th percentile) then it means a longer time, but the decision with risk is with them.
Why choose the 85th percentile?
The 85th percentile is common practice purely as it ‘feels right’. For most customers or stakeholders they’ll likely interpret this as “highly likely”, which will be good enough for them. Feel free to choose a higher percentile if you want less risk (but recognise it will be a longer duration!).
Common questions posed for multiple item estimation
Does this mean all stories are the same size?
No! See above.
Do we need to have lots of data for this?
Before considering how much data, the most important thing is stability of your system/process. For example if your work is highly seasonal, you might want to consider this in your input data to your forecast if the future work will be less ‘hectic’.
However, let’s get back to the question. You can get started with as little as three samples (three weeks or say three sprints worth) of data. The sweet spot is 7–15 samples, anything more than 15 and you’ll likely need to discard old data as it may negatively impact your forecasts.
With 5 samples we are confident that the median will fall inside the range of those 5 samples, so that already gives us an idea about our timing and we can make some simple projections.
(Source: Actionable Agile Metrics For Predictability)
With 11 samples we are confident that we know the whole range, as there is a 90% probability that every other sample will fall in that range.
(Source: German Tank Problem)
What if I don’t have any previous data?
Tools like the Excel sheet from Troy provide the ability to estimate your range in completed stories. Once you start the work, populate with your actual samples and change the spreadsheet to use ‘Data’ as an input.
What about if it’s a new technology/our team has changed?
Good question — throw away old data! Given you only need a few samples you should not let different contexts/team setups influence your forecast.
Should I do this at the beginning of my project/release and send to our stakeholders?
You should do it then and continue to doso as and when you get new samples, do not just do one forecast! Ensure you practice #ContinuousForecasting and caveat that any forecasts are a point in time based on current data. Remember, short term forecasts (i.e., a sprint) will be more accurate than longer ones (e.g., a year long forecast done at the start of a financial year).
What about alternative types of Monte Carlo Simulation? Markov chain etc.?
This is outside the scope of this article, but please check out this brilliant and thorough piece by Prateek Singh comparing the different types of Monte Carlo Simulation.
So does the opinion of individuals not matter?
Of course not :) These methods are just introducing an objective approach into that conversation, and getting us away from methods that can easily be manipulated by ‘group think’. Use it to inform your conversation, don’t just treat it as the answer.
Isn’t this more an “advanced” practice anyway? We’re pretty new to this way of working…
No! There is nothing in agile literature that says you have to start with story points (or Scrum/sprints for that matter), nor that you have to have been practicing other methods before this one. The problem with starting with methods such as story pointing is they are starting everyone off in a language no one understands. These other methods are not. In a world where unlearning and relearning is often the biggest factor in any adoption of new ways of working, I’d argue it’s our duty to make things easier for our people where we can. Speaking in a language they understand is key to that.
Conclusions
Story points != Agile.
Any true Agilista should be wanting to stay true to the manifesto and always curious about uncovering better ways of working. Hopefully this series presents some fair challenges to traditional approaches but, more importantly, alternatives you can put into practice right away in your context.
Let me know in the comments if you liked this series, if it challenged you, anything you disagree with and/or any ways to make it even better.
— — — — — — — — — — — — — — — — — — — — — — — — — —
References for this series:
Drunk Agile — Probabilistic Forecasting using Monte Carlo Simulation
George Dinwiddie — Software Estimation Without Guessing: Effective Planning in an Imperfect World
Jeff Sutherland — Sprint Burndown: by hours or by story points?
Jeff Sutherland — Story Points: Why are they better than hours?
John Cutler — Stop Playing Tetris (With Teams, Sprints, Projects, and Individuals)
Nick Brown — When Will We Finish? Using data to forecast when teams will deliver…
Prateek Singh — Will We Make It — Cars, Maps and Software Projects (Continuous Reforecasting)
Quora — What are the techniques set by the Scrum guidelines for a task estimation in Sprint Planning
Troy Magennis — Story Point Velocity or Throughput Forecasting — Does it matter?
Troy Magennis — Introduction to Basic Monte Carlo Forecasting
Willem-Jan Ageling — User Story Mapping & Probabilistic Forecasting