What is the latest thinking being shared at Agile conferences? The Agile Coaches at ASOS took a day out at SEAcon — The Study of Enterprise Agility conference to find out more…
A joint article by myself, Dan and Esha, fellow Agile Coaches here at ASOS Tech.
What is SEAcon?
According to the website, it first started in 2017, with the organisers creating the first-ever enterprise agility related meetup (SEAm) and conference (SEAcon) as they wanted to support organisations’ desires to be driven by an authentic purpose. Having attended the 2020 version of the conference and hearing some great talks, we knew it was a good one to go check out, our first time doing this as a team of coaches at ASOS.
This year, the conference had over 30 speakers across three different tracks — Enterprise, Start-up/Scale-up and Agile Leadership. This meant that there was going to be a good range of both established and new speakers covering a variety of topics. A particular highlight was the Agile Leadership track which had a number of speakers outside of software development but with plenty of applicable learnings, which was refreshing.
The conference itself
Morning
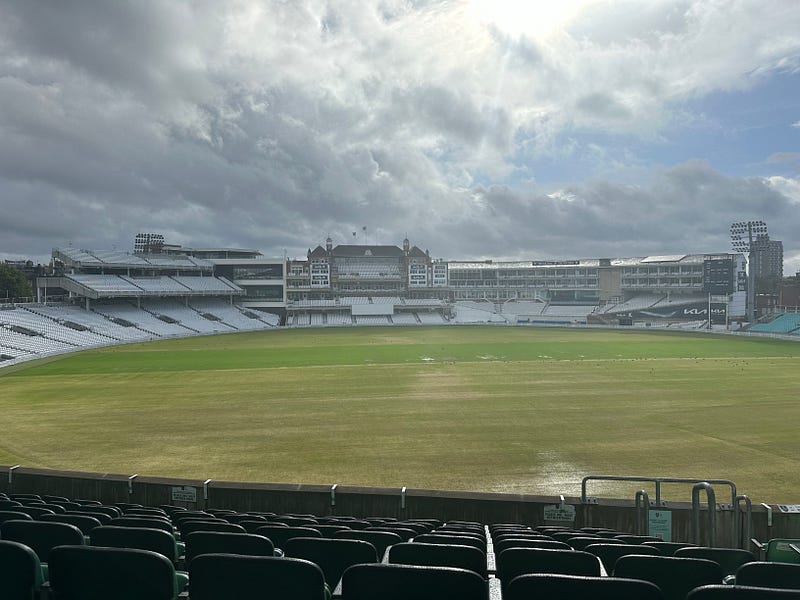
The conference was hosted at the Oval Cricket Ground, which was a fantastic venue!
We started the day by attending Steve Williams’ How to win an Olympic Gold Medal: The Agile rowing boatsession. This talk was so good and it set a high bar for all the sessions to follow that day. What was great about it was not only Steve's passion but the fact that there were so many parallels with what teams and organisations are trying to do with employing agility. One of our favourites was the concept of a ‘hot wash up’. Here the rowers would debrief after an exercise on how it went and share feedback amongst each other, all overseen/facilitated by the coach. Not just any coach mind you, this was with Jürgen Gröbler, one of the most successful Olympic coaches ever with 13 consecutive Olympic Gold medals.
Interestingly, Steve shared that Jürgen did not have the build of nor was ever a rower himself, which, when you consider the seemingly endless debate around ‘should Agile Coaches be technical?’ offers an alternative thought in our world. Another great snippet was that in a rowing team of four, work is always split evenly; shared effort and no heroes. There is also no expectation to operate at 100% effort all the time as you can’t be ‘sprinting’ constantly (looking at you Scrum 👀).
Late morning and lunch
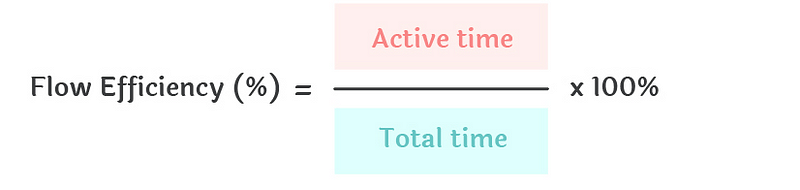
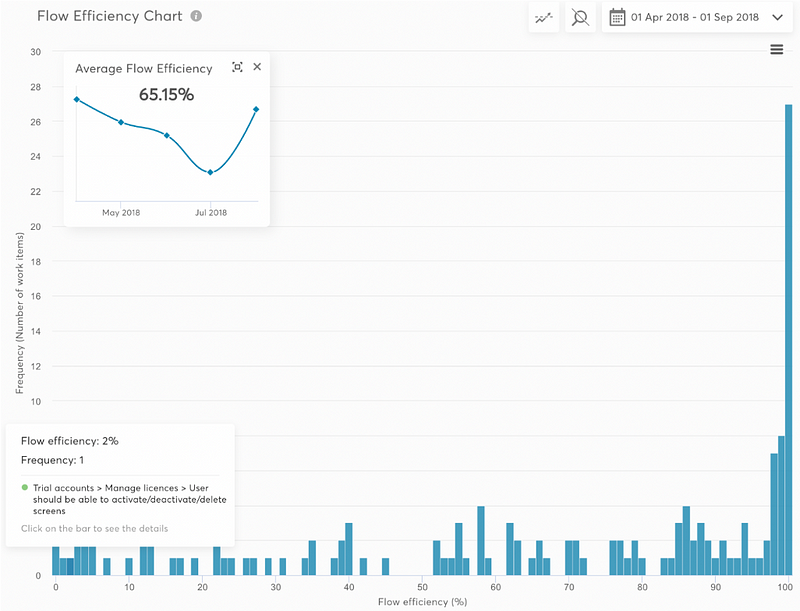
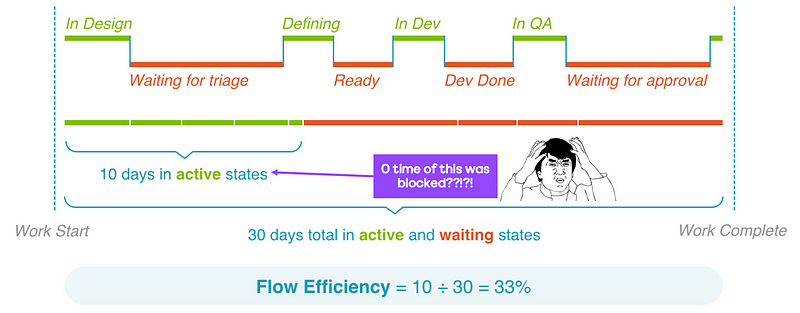
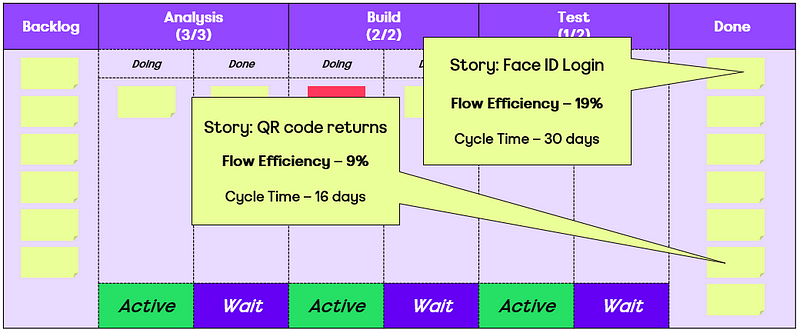
After the morning break, we reconvened and chose to check out Andrew Husak (Emergn) and his session on It’s not the people, it’s the system. We found this session very closely aligned with what we are looking at currently. It effectively covered how to measure the impact from the work you are doing is having in the organisation, with Andrew offering a nice blend of historical references (Drucker, Deming, Goldratt, etc.) and metrics (cycle time, lead time, work in progress, etc.) to share how Emergn focus on three themes of Value, Flow and Quality, with engagements they have.

A key thing here being about measuring end to end flow (idea -> in the hands of users) rather than just the delivery cycle (code started -> deployed to production). Albeit, it may be that you have to start with the delivery cycle first, gathering the evidence/data on improving it, before going after the whole ‘system’.
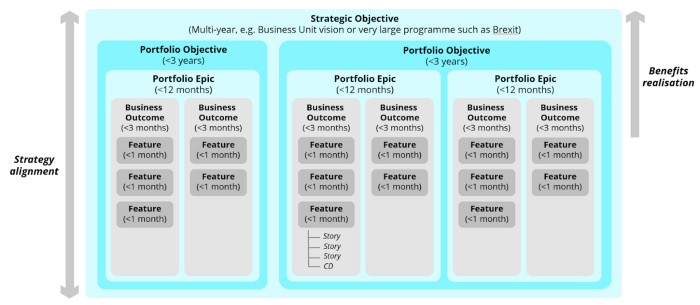
We ended late morning/early lunch by going to Stephen Wilcock (Bloom & Wild) on Pivot to Profitability. Now, it wasn’t quite all relevant to us and where we work currently (not the fault of the speaker!) however there were still useful learnings like mapping business outcomes to teams (rather than Project or Feature teams) and the importance of feature prioritisation by CD3 (Cost of Delay Divided by Duration). Although there are sources that argue CD3 may not be the most effective way to prioritise.
We took a break after that, chatting to other attendees and digesting the morning, then before we knew it, it was time for lunch. Conference lunches can be really hit or miss and thankfully a great selection was available and, unlike other conferences, there were multiple stations to get your food from so “hangry-ness” was averted.
Afternoon
After lunch we were all really looking forward to the Leadership styles in the Royal Navy talk however, once we sat down for the session we actually realised we were in The Alignment Advantage session by Richard Nugent. That would be one small criticism of the conference in that it was really difficult to find a printed schedule (none were given out) and it seems schedule changes like this suffered as a result.
Thankfully, this talk was totally worth it. At the minute, we are reviewing and tweaking our Agile Leadership training and this gave us tonnes of new thinking/material we could be leveraging around strategy and the importance of alignment in achieving this. In the talk, Richard posed a series of questions for us all to note down our take on (either within our team or our organisation), such as:
What is strategy?
What is your key strategic objective?
What is your definition of culture?
On a scale of 1–6, to what degree does your current culture support the delivery of a strategic objective?
What is the distinction between service and experience?
What is your x?
What was great was, rather than leave this ambiguously for us to answer, Richard validated our understanding by giving his view on what the answer was to all the above. After the session, we were all very energised about how we could be using this approach for leaders we work with in ASOS and baking this into our leadership training.
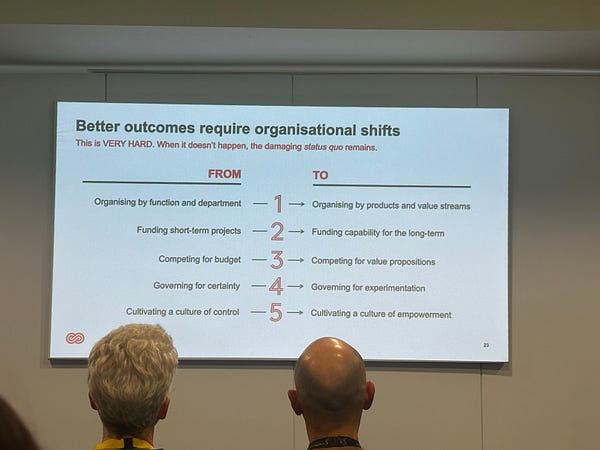
After Richard it was time for Jon Smart and Thriving over surviving in a changing world. As big fans of his book Sooner, Safer, Happier, we were all particularly excited about this talk, and we were not disappointed. Jon highlighted that organisational culture is at the core of thriving, however, culture cannot be created, it has to be nurtured.
Leaders need to provide clear behavioural guardrails that are contextual and need to be repeatedly communicated to enable teams and leaders to hold each other to account.
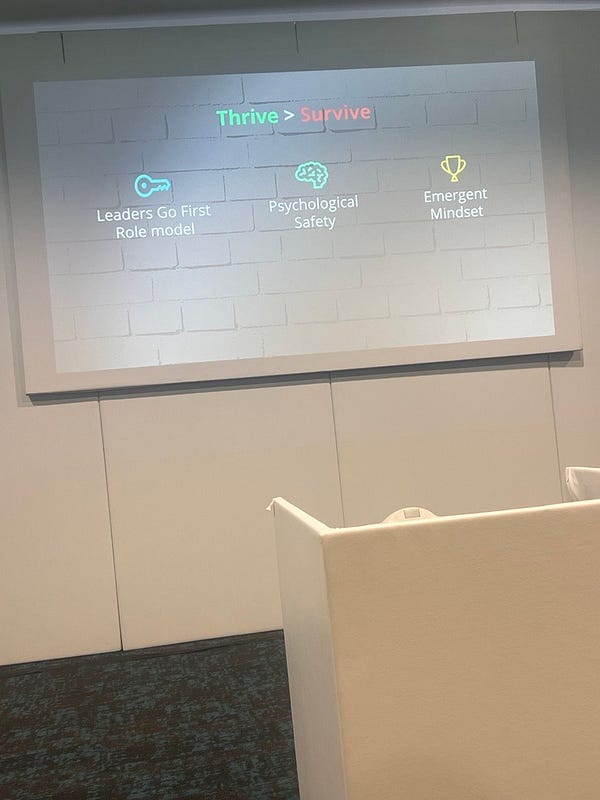
Jon went on to explain the three key factors for success:
Leaders go first, become a role model
Psychological safety
Emergent mindset; the future is unknown so experiment and optimise for that

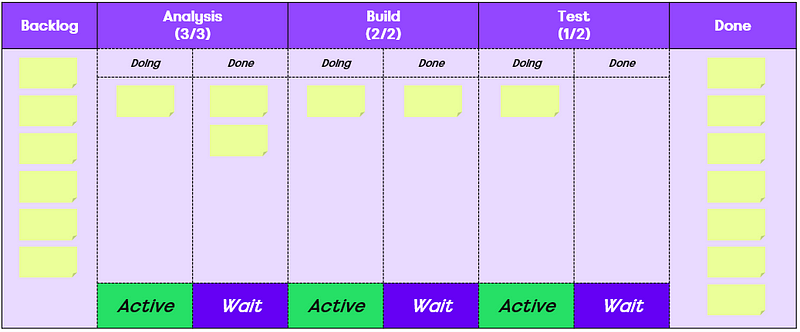
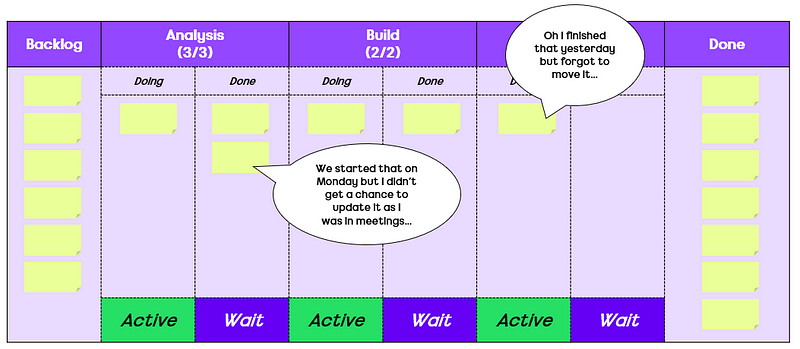
At ASOS, one of our focuses is on flow, so when Jon spoke about intelligent flow by optimising for outcomes, we were all naturally intrigued. By having high alignment (through OKRs) with minimum viable guardrails, teams are empowered to experiment on how to best achieve their north star. However, something that is always forgotten about is limiting WIP at all levels to create a pull not push system, where organisations stop starting and start finishing.
As we all had to leave early, the last session for the day we went to was Ben Sawyers Leadership Lessons from bomb disposal operations in Iraq and Afghanistan. Sharing stories, pictures and diagrams from his several tours, Ben provided a detailed explanation of how the British Army use Mission Command to create a shared understanding of goals, while enabling teams to decide and own their tactics and approach.

This decentralised approach to leadership echoed many of the other talks throughout the day and reiterated the importance of trust to reach success. Ben also referred to Steve Williams’ approach of using a ‘hot wash up’ to reflect on recent activities and consider improvements for next time. To round off, it was interesting to hear that despite so many contextual differences, similarities in approaches have led to success in many different industries.
Key learnings
So what were our main takeaways?
One of the standouts has to be about the concepts around agility traversing multiple industries and domains, not limited to software development. It’s a great reminder as Coaches about the importance of language and how, when it comes to agility, people are likely already applying aspects of this in their day to day but calling it something else, and this is ok. Being able to have more anecdotes of what different industries use which are similar to what teams are using is great.
Secondly, the importance of focusing on outcomes and measuring impact when it comes to ways of working. As Coaches we’re talking more and more about moving teams away from measuring things like agile compliance (stand-up attendance, contribution to refinement) to the things that truly matter (speed, quality, value delivery).
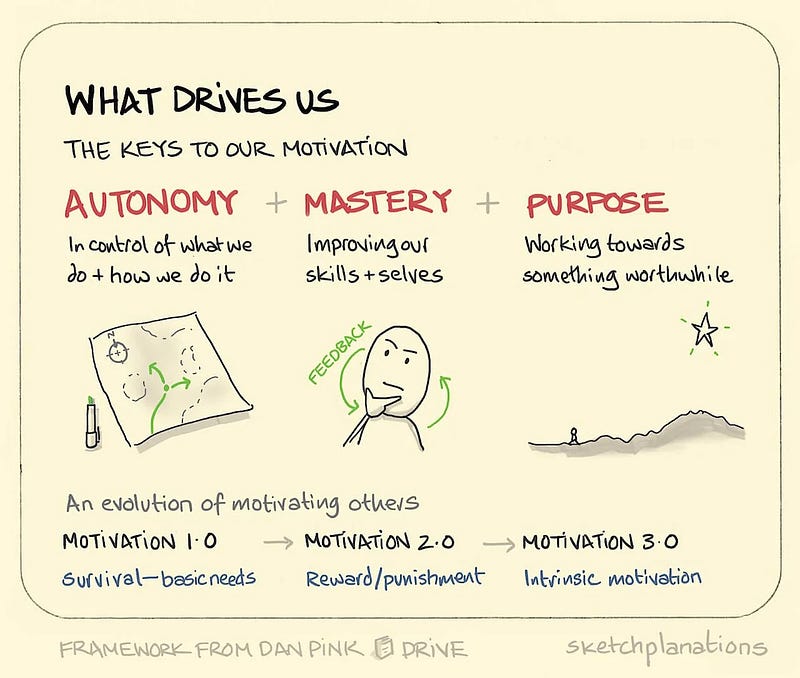
Finally, the recurring theme of being outcome oriented and setting direction, allowing individuals and teams to choose their own path in how they get there being the most effective way to work. Rather than fixating on the how (e.g. methods/frameworks), it’s clear that whether you’re an agilist or not, alignment in strategy and direction is paramount for success.
For its price, SEAcon is probably the best value for money agile conference you’ll get the chance to attend. Good talks, networking and food make it one to watch out for when tickets go on sale — hopefully we’ll be back there in 2024!