Cynefin

There’s no such thing as a committed outcome

A joint article by both myself and Ellie Taylor, a fellow Ways of Working Enablement Specialist here at Nationwide.

The Golden Thread

As we start a new year, focusing on outcomes has been a common topic of discussion in our work in the last few weeks.

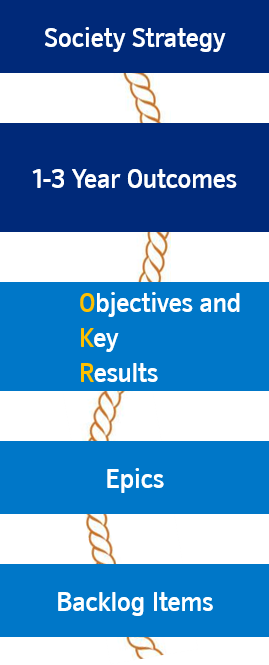
Within Nationwide, we are working towards instilling a ‘Golden Thread’ in our work — starting with our strategy, then moving down to three year and in-year outcomes, breaking this down further into quarterly Objectives and Key Results (OKRs) and finally Backlog Items (and if you’d like to go even further — Tasks).

This means that everyone can see how the work they’re doing fits (or maybe does not fit!) into the goals of our organisation. When you consider the work of Daniel Pink, we’re really focusing here on that ‘purpose’ aspect in trying to instil that in everything we do.

As Enablement Specialists, part of our role is to help coach the leaders and teams we work with across our Member Missions to really focus on outcomes over outputs. This is a common mantra you’ll hear recited in the Agile world, with some even putting forth the argument that it should in fact be the other way round. However, orientating around outcomes is our chosen path, and thus we must focus on helping facilitate the gathering of good outcomes.

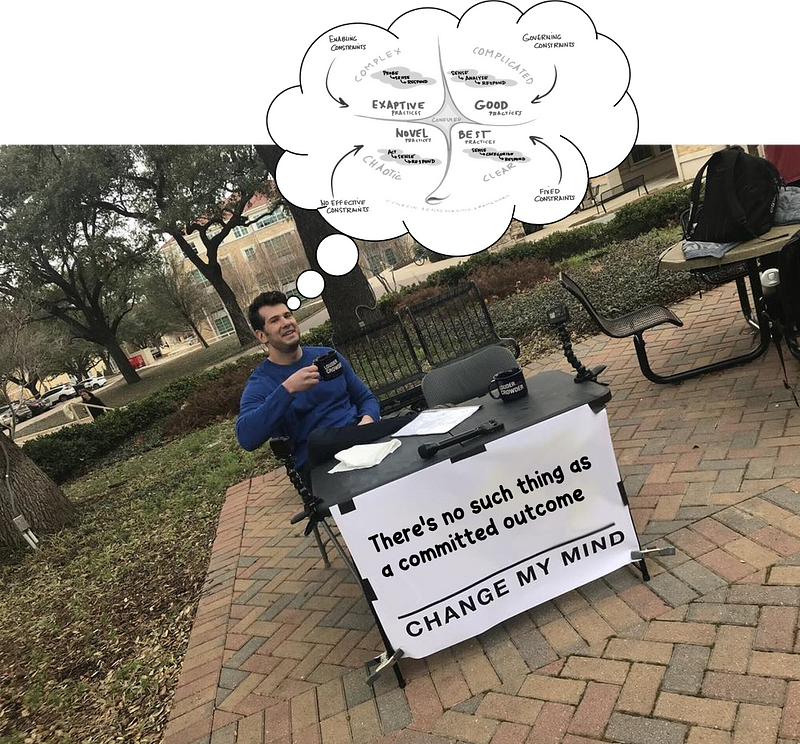
Yet, in moving to new, outcome oriented ways of working, a pattern (or anti-pattern) has emerged— one of which is the concept of a ‘committed outcome’.

“You can’t change that, it’s a committed outcome”

“We’ve got our committed outcomes and what the associated benefits are”

“Great! We’ve got our committed outcomes for this year!”

This became a hot topic amongst our team — what really is an outcome and is it possible to have a committed outcome?

What is an Outcome?

If we were to look at a purely dictionary definition of the word, an outcome is “something that follows as a result or consequence”. If you want help in what this means in a Lean-Agile context, the book Outcomes over Output helpfully defines an outcome as “a change in human behaviour”. Which we can then tweak for our context to mean ‘something that follows as a result or consequence, which could also be defined as a change in member or colleague behaviour’.

However this definition brings about uncertainty. How can we have certainty over the outcomes given they’re changes in behaviour? Well a simple way is to call them committed outcomes. That way we’ll know what we’ll be getting. Right?

Well this doesn’t quite work…

Outcomes & Cynefin

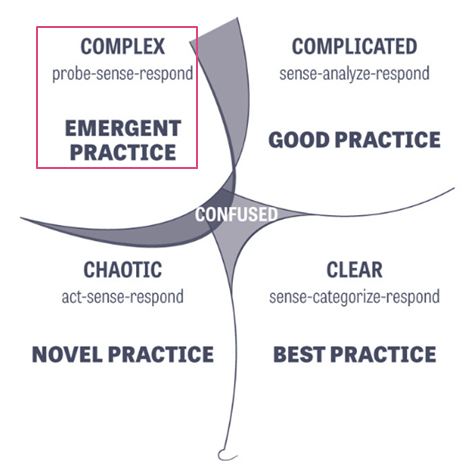
This is where those focused in introducing new ways of working and particularly leadership should look to leverage Cynefin. Cynefin is a sense-making model originally developed by Dave Snowden to help leaders make decisions by understanding how predictable or unpredictable their problems are. In the world of business agility, it’s often a first port of call to help us understand the particular context teams are working in, and then in turn how best to help them maximise their flow of work by selecting a helpful approach from the big bag of tools and techniques.

The model introduces 4 domains: Clear, Complicated, Complex and Chaotic, which can then be further classified as predictable or unpredictable in nature.

There is also a state of Confused where it is unclear which domain the problem fits into and further work is needed to establish this before attempting to identify the solution.

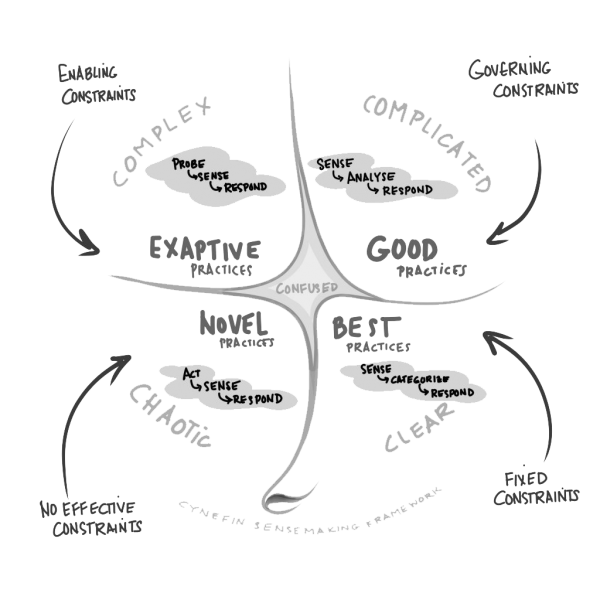
Source: About — Cynefin Framework

Both Clear and Complicated problems are considered by the model to be predictable since they have repeatable solutions. That is, the same solution can be applied to the same problem, and it will always work. The difference between the two being the level of expertise needed to solve.

The solution to Clear problems is so obvious that a child can solve it, or if expertise is needed the solution is still obvious and there’s normally only one way to solve the problem. Here is where it’s appropriate to use “best practice”. [example: tying shoelaces, riding a bike)

In the Complicated domain, more and more expertise is needed the more and more complicated the problem gets. The outcome is predictable because it has been solved before, but it will take an expert to get there. [example: a mechanic fixing a car, a watchmaker fixing a watch]

The Complex and Chaotic domains are considered unpredictable. The biggest difference between the two from a business agility perspective is whether it is safe to test and learn; ‘yes’ for Complex and definitely ‘no’ for Chaotic.

Complex problems are ones where the solution, and the way in which to get to that solution (i.e. the practices) emerge over time because we’ve never done them before, in this context, environment, etc. Cause and effect are only understood with hindsight, so you can only possibly know what happens and any side-effects of a solution once created. The model describes this activity as probing, trying out some stuff to find out what happens. And this is key to why this domain is a sweet spot for business agility. We need to try out something in such a way, typically small, that ensures that if it doesn’t work as expected, the consequences are minimised. This is often referred in our community as ‘safe to fail.’

And finally, Chaos. This is typically a transient state; it resolves itself quickly (not always in your favour!) and is very unpredictable. This domain is certainly not a place for safe to fail activity. Decisive action is the way forward, but there is also a high degree of choice in the solution and so often novel practices emerge.

Ok, so what’s the issue?

The issue here is that when we think back to focusing on outcomes, and specifically when you hear someone say something is a committed outcome, what’s more likely is that it’s a (committed) output.

It’s something you’re writing down that you’re going to ‘do’ or ‘produce’. Due to the fact that most of what we do sits in the Complex domain, we can’t possibly know (for certain) whether what we are going to ‘do’ will definitely achieve the outcome we’re after until we do it. We also don’t even know if the outcome we think we are after is the right one. Thus, it is nonsensical (and probably impossible!) to ‘commit’ to it. It’s unfortunately trying to apply thinking from the Clear domain to something that is Complex. This is a worry, as now these outcomes become something that we’ll do (output) rather than something we’ll go after (outcome).

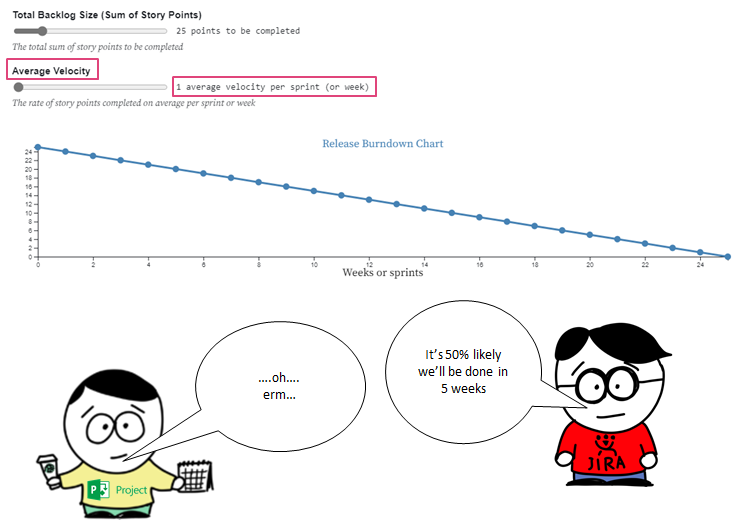
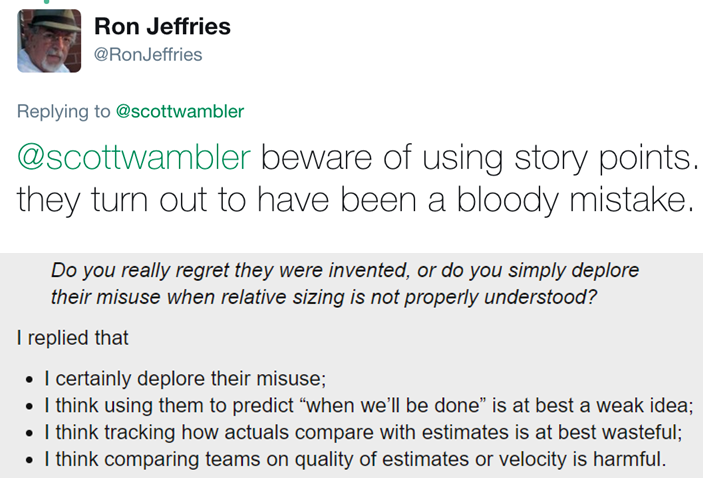
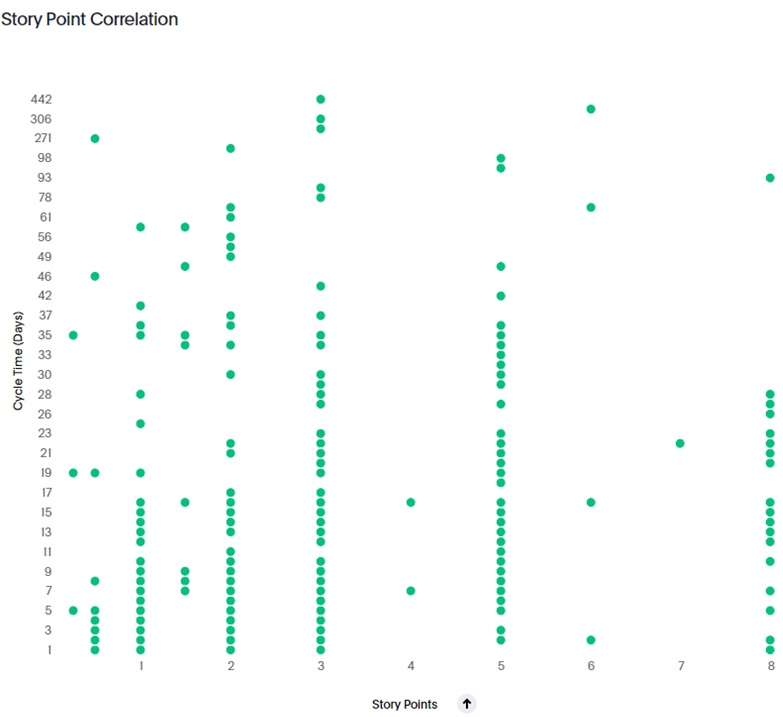
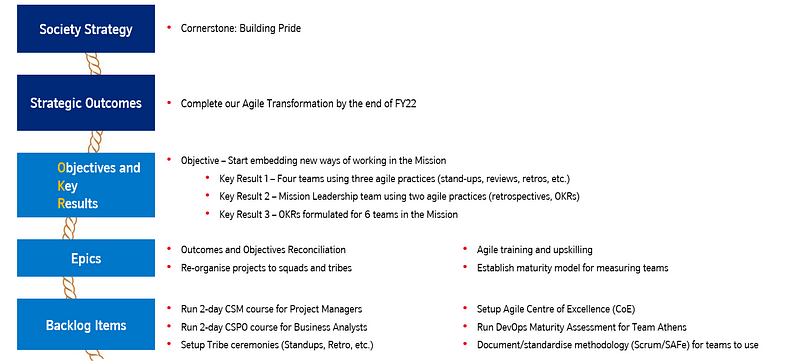
In lots of Agile Transformation or Ways of Working initiatives, this manifests itself at team level where large numbers of Scrum teams are stuck in a world where they still fixate on “committed number of items/story points” — ignoring the fact that this left Scrum ten years ago. Scrum Teams commit to going after both long-term (product) and short-term (sprint) goals, expressed as outcomes, with the work they do in the product/sprint backlog being how they’re trying to go after those. They do this because they know their work is complex. The same goes for the wider organisation wide ‘transformation’, which is treated as a programme where, by a pre-determined end date (usually 12 months), we will all be ‘transformed’. This of course can only be demonstrated in output (number of teams, number of people trained and certified, etc.) due to the mindset it is being approached with.

The problem with committing to an outcome (read: output) is that it stifles empowerment, creativity, and innovation, turning your golden thread from something meaningful, purposeful that celebrates accountable freedom, to output oriented, feature factory measured agile theatre.

Ultimately, this means any new ways of working approach is likely to be sub-optimal at best — it’s a pivot without a pivot, leading to everyone in the system delivering output, delivering this output faster, yet perplexed at the lack of meaningful impact. Meaning we neglect the outcomes and experimenting with many ways in our real desired results of delighting members and colleagues.

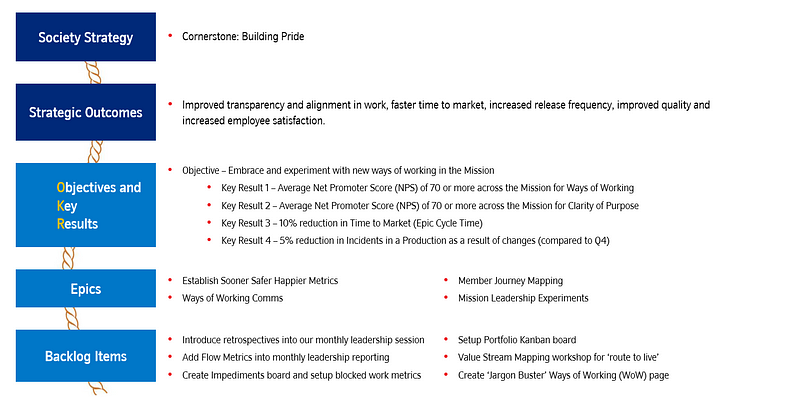
What we want to focus on are the problems we want to solve, which comes back to the member, user or colleague behaviours that drive business results and the things we can do to help nudge these. Ideally, we’d then have meaningful and, where appropriate, flow and value based measures to quantify these and track progress.

Summary

In closing, some key points to reaffirm when focusing on outcomes:

  • Outcomes are something that follows as a result or consequence

  • Cynefin is a sense-making model originally developed by Dave Snowden to help leaders make decisions by understanding how predictable or unpredictable their problems are.

  • Cynefin has 4 domains: Clear, Complicated, Complex and Chaotic, which can then be further classified as predictable or unpredictable in nature.

  • There is also a state of Confused where it is unclear which domain the problem fits into and further work is needed to establish this before attempting to identify the solution.

  • The work we do regarding change is generally in the Complex domain

  • As the work is Complex, there is no way we can possibly ‘commit’ to what an outcome will be as the relationship between the two is not known

  • Outcomes are things that we’d like to happen (more engaged staff, happier members) because of the work that we do

  • When you hear committed outcomes — people most likely mean outputs

  • Use the outputs as an opportunity to focus on the real problems we want to solve

  • The problems we want to solve should come back to the member, user or colleague behaviours that drive business results (which are the actual ‘outcomes’ we want to go after)

What do you think about when referring to outcomes? 

Have you had similar experiences?

Let us know in the comments below or tweet your thoughts to Ellie or myself :)

Story Pointless (Part 2 of 3)

The second in a three-part series on moving away from Story Points and how to introduce empirical methods within your team(s). 

Part one refamiliarised ourselves with what story points are, a brief history lesson and facts about them, the pitfalls of using them and how we can use alternative methods for single item estimation.

Part two looks at probabilistic vs. deterministic thinking, the use of burndown/burnups, the flaw of averages and monte carlo simulation for multiple item estimation.

Forecasting

You’ll have noticed in part one I used the word forecast a number of times, particularly when it came to the use of Cycle Time. It’s useful to clarify some meaning before we proceed.

What do we mean by a forecast?

Forecast — predict or estimate (a future event or trend).

What does a forecast consist of?

A forecast is a calculation about the future that includes both a range and a probability of that range occurring.

Where do we see forecasts?

Everywhere!

Sources: FiveThirtyEight & National Hurricane Centre

Forecasting in our context

In our context, we use forecasting to answer the key questions of:

  • When will it be done?

  • What will we get?

Which we typically do by:

Which we then visualize as a burnup/burndown chart, such as the example below. Feel free to play around with the inputs:

https://observablehq.com/embed/@nbrown/story-pointless?cells=viewof+work%2Cviewof+rate%2Cchart

All good right? Well not really…

The problems with this approach

The big issue with this approach is that the two inputs into our forecast(s) are highly uncertain, both are influenced by;

  • Additional work/rework

  • Feedback

  • Delivery team changes (increase/decrease)

  • Production issues

Neither inputs can be known exactlyupfront nor can they be simply taken as a single value, due to their variability.

And don’t forget the flaw of averages!

Plans based on average, fail on average (Sam L. Savage — The Flaw of Averages)

The above approach means forecasting using average velocity/throughput which, at best, is the odds of a coin toss!

Source:

Math with bad drawings — Why Not to Trust Statistics

Using averages as inputs to any forecasting is fraught with danger, in particular as it is not transparent to those consuming the information. If it was it would most likely lead to a different type of conversation:

But this is Agile — we can’t know exactly when something will be done!?!…

Source: Jon Smart — Sooner, Safer, Happier

Estimating when something will be done is particularly tricky in the world of software development. Our work predominantly sits in the domain of ‘Complex’ (using Cynefin) where there are “unknown unknowns”. Therefore, when someone asks, “when will it be done?” or “what will we get?” — when we estimate, we cannot give them a single date/number, as there are many factors to consider. As a result, you need to approach the question as one which is probabilistic (a range of possibilities) rather than deterministic (a single possibility).

Forecasts are about predicting the future, but we all know the future is uncertain. Uncertainty manifests itself as a multitude of possible outcomes for a given future event, which is what science calls probability.

To think probabilistically means to acknowledge that there is more than one possible future outcome which, for our context, this means using ranges, not absolutes.

Working with ranges

Communicating such a wide range to stakeholders is definitely not advisable nor is it helpful. In order to account for this, we need an approach that allows us to simulate lots of different scenarios.

The Monte Carlo method is a method of using statistical sampling to determine probabilities. Monte Carlo Simulation (MCS) is one implementation of the Monte Carlo method, where a real-world system is used to describe a probabilistic model. The model consists of uncertainties (probabilities) of inputs that get translated into uncertainties of outputs (results).

This model is run a large number (hundreds/thousands) of times resulting in many separate and independent outcomes, each representing a possible “future”. These results are then visualised into a probability distribution of possible outcomes, typically in a histogram.

TLDR; this is getting nerdy so please simplify

We use ranges (not absolutes) as inputs in the amount of work and the rate we do work. We run lots of different simulations to account for different outcomes (as we are using ranges).

So instead of this:

https://observablehq.com/embed/@nbrown/story-pointless?cells=viewof+work%2Cviewof+rate%2Cchart

We do this:

https://observablehq.com/embed/@nbrown/story-pointless?cells=chart2%2Cviewof+numberOfResultsToShow%2Cviewof+paceRange%2Cviewof+workRange

However, this is not easy on the eye! 

So what we then do is visualise the results on a Histogram, showing the distribution of the different outcomes.

We can then attribute percentiles (aka a probability of that outcome occurring) to the information. This allows us to present a range of outcomes and probability of those outcomes occurring, otherwise known as a forecast.

Meaning we can then move to conversations like this:

The exact same approach can be applied if we had a deadline we were working towards and we wanted to know “what will we get?” or “how far down the backlog will we get to”. The input to the forecast becomes the number of weeks you have, with the distribution showing the percentage likelihood against the number of items to be completed.

Tools to use

Clearly these simulations need computer input to help them be executed. Fortunately there are a number of tools out there to help:

  • Throughput Forecaster — a free and simple to use Excel/Google Sheets solution from troy.magennis that will do 500 simulations based on manual entry of data into a few fields. Probably the easiest and quickest way to get started, just make sure you have your Throughput and Backlog Size data.

  • Actionable Agile — a paid tool for flow metrics and forecasting that works as standalone SaaS solution or integrated within Jira or Azure DevOps. This tool can do up to 1 million simulations, plus gives a nice visual calendar date for the forecasts and percentage likelihood.

Source:

Actionable Agile Demo

  • FlowViz — a free Power BI template that I created for teams using Azure DevOps and GitHub Issues that generates flow metrics as well as monte carlo simulations. The histogram visual provides a legend which can be matched against a percentage likelihood.

Summary — multiple item forecasting

  • A forecast is a calculation about the future that includes both a range and a probability of that range occurring

  • Typically, we forecast using single values/averages — which is highly risky (odds of a coin toss at best)

  • Forecasting in the complex domain (Cynefin) needs to account for uncertainty (which using ‘average’ does not)

  • Any forecasts therefore need to be probabilistic (a range of possibilities) not deterministic (a single possibility)

  • Probabilistic Forecasting means running Monte Carlo Simulations (MCS) — simulating the future lots of different times

  • To do Monte Carlo simulation, we need Throughput data (number of completed items) and either a total number of items (backlog size) or a date we’re working towards

  • We should always continuously forecast as we get new information/learning, rather than forecasting just once

Ok but what about…

I’m sure you have lots of questions, as did I when first uncovering these approaches. To help you out I’ve collated the most frequently asked questions I get, which you can check out in part three

— — — — — — — — — — — — — — — — — — — — — — — — — —

References:

Story Pointless (Part 1 of 3)

The first in a three-part series on moving away from Story Points and how to introduce empirical methods within your team(s).

Part one refamiliarises ourselves with what story points are, a brief history lesson and facts about them, the pitfalls of using them and how we can use alternative methods for single item estimation.

What are story points?

Story points are a unit of measure for expressing an estimate of the overall effort (or some may say, complexity) that will be required to fully implement a product backlog item (PBI), user story or any other piece of work.

When we estimate with story points, we assign a point value to each item. Typically, teams will use a Fibonacci or Fibonacci-esque scale of 1,2,3,5,8,13,21, etc. Teams will often roll these points up as a means of measuring velocity (the sum of points for items completed that iteration) and/or planning using capacity (the number of points we can fit in an iteration).

Why do we use them?

There are many reasons why story points seem like a good idea:

  • The relative approach takes away the ‘date commitment’ aspect

  • It is quicker (and cheaper) than traditional estimation

  • It encourages collaboration and cross-functional behaviour

  • You cannot use them to compare teams — thus you should be unable to use ‘velocity’ as a weapon

A brief history lesson

Some things you might not know about story points:

Ron’s current thoughts on the topic

  • Story points are not (and never have been) mentioned in the Scrum Guide or viewed as mandatory as a part of Scrum

  • Story points originated from eXtreme Programming (XP)

  • - Chrysler Comprehensive Compensation (C3) project was the birth of XP

  • - They originally estimated in “ideal days” and later, unitless Story Points

  • - Ron Jeffries is credited with being the person who introduced them

  • James Grenning invented Planning Poker which was first publicised in Mike Cohn’s book Agile Estimating and Planning

  • Mountain Goat Software (Mike Cohn) own the trademark on planning poker cards and the copyright on the number sequence used for story point estimation

Problems with story points

What time would you tell your 

 friends you’d meet them?

They do not speak in the language of our customer

Telling our customers and stakeholders something is a “2” or a “3” does not help when it comes to new ways of working. What if we did this in other industries — what would you think as a customer? Would you be happy?

They may encourage the right behaviours, but also the wrong ones too

Agileis all about collaboration, iterative execution, customer value, and experimentation. Teams can have ‘high velocity’ but be finishing everything on the last day of the sprint (not working at a sustainable pace/mini waterfalls) and/or be delivering the wrong things (build the wrong thing). Similarly, teams are pressured to ‘increase velocity’ which is easy to artificially inflate by making every 2 into a 3, 3 into a 5, etc. — then we have increased our velocity!

They are hugely inconsistent within a team

Plot the actual time from starting to finishing an item (in days) against the story point estimate. Compare the variance for stories that had the same points estimate:

For this team (in Nationwide) we can see:

  • 1 point story — 1–59 days

  • 2 point story — 1–128 days

  • 3 point story — 1–442 days

  • 5 point story — 2–98 days

  • 8 point story — 1–93 days

They are a poor mechanism for planning / full of assumptions

Not only is velocity a highly volatile metric but it also encourages playing ‘Tetris’ with people in complex work. When estimating stories, teams purely take the story and acceptance criteria as written. They do not account for various assumptions (customer availability, platform reliability) and/or things that can go wrong or distract them (what is our WIP, discovery, refinement, production issues, bug-fixes, etc.) during an iteration.

Uncovering better ways

Agile has always been about “uncovering better ways”, after all it’s the first line of the Manifesto!

Given the limitations with story points, we should be open to exploring alternative approaches. When looking at uncovering new approaches, we need to be able to:

  • Forecast/Estimate a single item (PBI/User Story)

  • Forecast/Estimate our capacity at a sprint level (Sprint Backlog)

  • Forecast/Estimate our capacity at a release level (Release Backlog)

Source: Jon Smart — Sooner, Safer, Happier

Estimating when something will be done is particularly tricky in the world of software development. Our work predominantly sits in the domain of ‘Complex’ (using Cynefin) where there are “unknown unknowns”. Therefore, when someone asks, “when will it be done?” or “what will we get?” — we cannot estimate give them a single date/number, as there are many factors to consider. As a result, you need to approach the question as one which is probabilistic (a range of possibilities) rather than deterministic (a single possibility).

Forecasts are about predicting the future, but we all know the future is uncertain. Uncertainty manifests itself as a multitude of possible outcomes for a given future event, which is what science calls probability.

To think probabilistically means to acknowledge that there is more than one possible future outcome which, for our context, this means using ranges, not absolutes.

Single item forecast/estimation

One of the two key flow metrics that inputs into single item estimation is our Cycle Time. Cycle time is the amount of elapsed time between when a work item started and when a work item finished. We visualise this on a scatter plot, like so:

On the scatter plot, each ‘dot’ represents a PBI/user story, plotted against the completion date and the time (in days) it took to complete. Our 85th percentile (highlighted in the visual) tells us that 85% of our stories are completed within n days or less. Therefore with this team, we can say that 85% of the time we finish stories in 26 days or less.

We can communicate this to customers and stakeholders by saying that:

“If we start work on this today, there is an 85% chance it will be done in 26 days or less”

This may be sufficient for your customer (if so — great!), however they may push for it sooner. If, for instance, with this team they wanted the story in 7 days, you can show them (with data) that this is only 50% likely. Use this as a basis to start the conversation with them (and the rest of the team!) around breaking work down.

What about when work commences?

If they are happy with the forecast, and we start work on an item, it’s important that we don’t stop there and ensure we continue to manage the expectations of the customer.

Work Item Age is the second metric to use to maintain a continued focus on flow. This is the amount of time (in days) between when a item started and the current time. This applies only to items that are still in progress.

Each dot represents a user story and the age (in days) of that respective PBI/user story so far.

Use this in the Daily Scrum to track the age of an item against your 85th percentile time, as well as comparing to where an item is in your process.

If it is in danger of ‘breaching’ the cycle time, swarm on an item or break it down accordingly. If this can’t be done, work with your stakeholder(s) to collaborate on how to achieve the best outcome.

As a Scrum Master / Agile Delivery Manager / Coach, your role would be to guide the team in understanding the trade offs of high WIP age items vs. those closest to done vs. starting something new — no easy task!

Summary — Single Item Forecasting

In terms of a story pointless approach to estimating a single item, try the following:

  1. Prioritise your backlog

  2. Use your Cycle Time scatter plot and 85th percentile

  3. Take the next highest priority item on your backlog

  4. As a team, ask — “Do we think this can be delivered within our 85th percentile?”

  5. (Note: you can probe further and ask ‘can this be delivered within our 50th percentile?” to promote further slicing/refinement)

  6. If yes, then let’s get started/move it to ‘Ready’ 

  7. (considering your work-in-progress)

  8. If no, then find out why/break it down till it is small enough

  9. Once we start work on items, use Work Item Age as a leading indicator for flow

  10. Manage Work Item Age as part of your Daily Scrum, if it looks like it may exceed the 85th percentile — swarm/slice!

Please note: it’s best to familiarise yourself with what your 85th percentile is first (particularly in comparison to your cadence). 

If it’s 100+ days then you should be focusing initially on reducing that time — this can be done through various means such as pairing, mobbing, story mapping, story slicing, lowering WIP, etc.

But what about for multiple items? And what about…

For multiple item forecasting, be sure to check out part two.

If you have any questions, feel free to add them to the comments below in time for part three, which will cover common questions/observations people make about these new methods…

— — — — — — — — — — — — — — — — — — — — — — — — — —

References: